

An AI attractiveness test measures your facial geometry from a single photo and returns a reproducible score. Treat it as a useful data point, not a final verdict on how you look.
Here is what you can do right now:
- Take a front-facing photo in natural light, neutral expression, hair off your forehead.
- Run it through a free tool such as The Face Report, which maps 478 facial landmarks and returns a 0–100 harmony score.
- Read the metric breakdown to see which proportions are pulling your score up or down.
- If you want that insight applied directly to your dating profile, DoubleMyMatches' AI Dating Photo Coach takes it further: it scores, ranks, and gives per-photo feedback, then discards your images.
The score tells you about geometric harmony. It does not tell you whether you are charming, warm, or good company. Keep that distinction in mind throughout.
Table of Contents
- How an AI attractiveness test processes your photo from upload to score
- What facial metrics these tests actually measure
- How to take a photo that gives you a reliable score
- What your score and tier actually mean
- Limitations, bias, and privacy you need to know
- How to turn your attractiveness-test report into better dating photos
- Common misconceptions about attractiveness scores
- How hairstyle, makeup, and accessories affect your score
- Key takeaways
- The score is a tool, not a truth
- DoubleMyMatches goes further than a facial geometry score
- Useful sources
How an AI attractiveness test processes your photo from upload to score
The process runs in four stages, and knowing each one helps you understand where variation creeps in.
Stage 1: Photo capture. You upload or take a photo. The tool reads the image file and checks for a single detectable face.
Stage 2: Landmark detection. The model places reference points across your face. The Face Report uses 478 landmarks, covering the eyes, nose, mouth, jawline, and hairline. More landmarks generally mean finer measurement, but only if the underlying model is well-trained.

Stage 3: Metric calculation. The tool measures distances and ratios between landmark pairs: eye spacing, nose breadth, face height-to-width, and so on. Each ratio is compared against a target value (more on those in the next section).
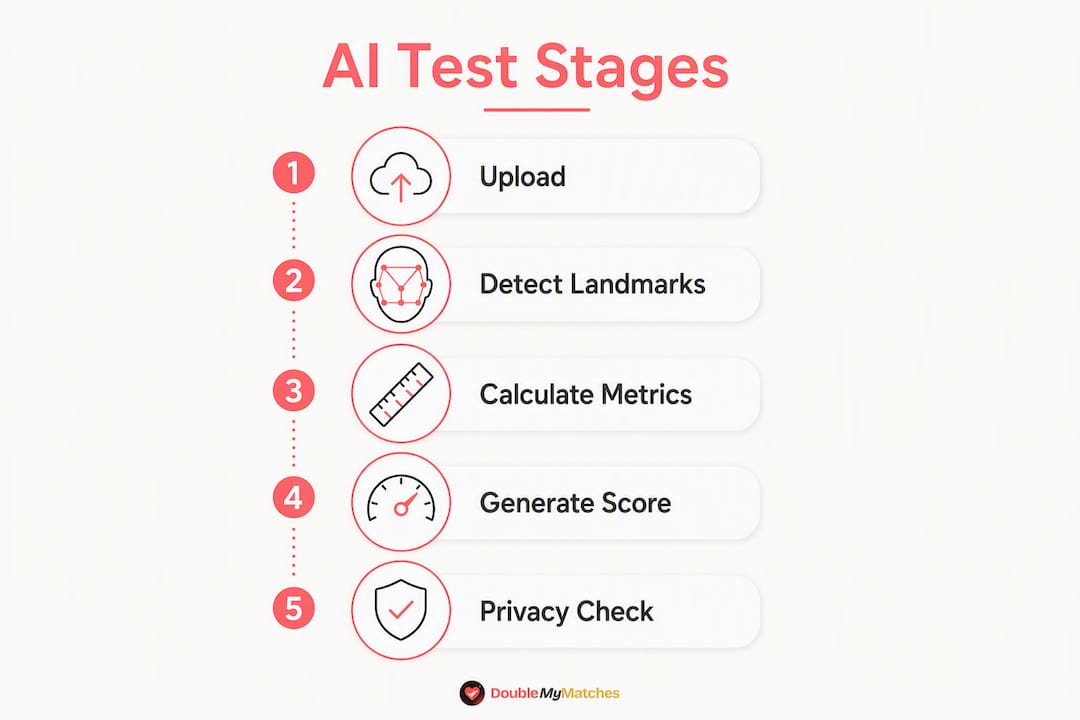
Stage 4: Weighted score and report. The individual metric scores are combined into a single figure. The Face Report discloses its formula and notes that its weights are product-specific calibrations, not universal scientific laws. Tools that do not publish their weights are harder to interpret.
Privacy matters here. Some tools process images entirely in the browser, so your photo never leaves your device. Face Shape Detector and The Face Report both state that their free tests use client-side processing. Server-upload tools may retain images or use them to retrain models. Always check the terms before you upload.
Score variation between test runs usually comes from four sources: camera lens distortion, head angle, expression, and lighting. A slight tilt or a shadow across one cheek shifts landmark positions and changes the output. That is not a flaw in the tool; it reflects how sensitive geometric measurement is to photo conditions.
What facial metrics these tests actually measure
Most AI attractiveness tools report a core set of geometric ratios. Here is what each one captures and why it matters.
- Bilateral symmetry. The degree to which the left and right halves of your face mirror each other. Research consistently links higher symmetry to perceived attractiveness, though the effect size varies across cultures.
- Facial thirds. Your face is divided horizontally into three equal zones: hairline to brow, brow to nose base, nose base to chin. Balanced thirds are associated with a harmonious appearance.
- Facial fifths (eye-width rule). Vertically, the face is divided into five equal widths, each roughly one eye-width wide. The tool checks whether your eye spacing and face width align with this ratio.
- Golden ratio / phi proximity. Certain distances (e.g. face length to width, nose to mouth) are compared against 1.618. Developers note this is a product calibration, not a proven universal law.
- Face length-to-width ratio. A narrower face scores differently from a wider one; the "ideal" varies by tool.
- Canthal tilt. The angle of the outer eye corner relative to the inner corner. A slight upward tilt is often scored positively.
- Jawline prominence. Measured by the sharpness of the angle between the jaw and chin. Some tools score this separately; others fold it into symmetry.
- Skin texture and clarity. A minority of tools add an appearance layer, assessing smoothness or blemishes from pixel data. This is an appearance cue, not a geometric ratio.
Some tools also report eye size, mouth width, and midface ratio as supplementary metrics. These sit between pure geometry and appearance assessment.
Example calibration from one disclosed tool:
Source: The Face Report's published formula. These are that tool's calibrations, not industry-wide constants.
The psychometrics of rating facial attractiveness show that even human raters disagree on scores, which is one reason geometric proxies exist: they are at least consistent within a single tool.
How to take a photo that gives you a reliable score
Photo quality is the single biggest source of noise in your results. Get this right and your score becomes genuinely informative.
Checklist for a test-ready photo:
- Neutral expression (no smile, no squint, mouth gently closed)
- Straight-on frontal angle, eyes level with the camera
- Hair pulled back or off the forehead so landmarks are visible
- Even, diffuse lighting (a north-facing window works well; avoid direct sun or overhead bulbs)
- No heavy filters, beauty modes, or retouching
- Single face in the frame
- High resolution, natural colour, no heavy compression
For file type, JPEG at full quality or PNG both work. Avoid screenshots of screenshots; each compression step degrades landmark precision.
Common mistakes that lower scores:
- Tilted head (shifts symmetry readings)
- A wide smile (distorts mouth width and midface ratios)
- Side lighting or shadows across one cheek (fools the symmetry algorithm)
- Sunglasses or hair covering the eye area
Pro Tip: For consistent results across multiple test runs, use the same phone, stand the same distance from the camera, and mark a spot on the floor with tape. Repeat the photo in the same spot and lighting each time. This controls for variables that have nothing to do with your face.
Scores are strongly affected by photo conditions, so a single poorly-lit photo can produce a result that is several points lower than a well-controlled one. The photo is part of the experiment.
What your score and tier actually mean
Most tools use either a 0–100 scale or a 1–10 scale. Here is how bands typically map across open tools.
| Band (0–100) | Common label | What it suggests |
|---|---|---|
| 85–100 | Exceptional | Top geometric harmony; rare in the general population |
| 70–80 | Above average | Strong proportions across most metrics |
| 55–68 | Balanced | Close to population median; minor asymmetries |
| 40–54 | Near-balanced | Some metrics below target; room to improve photo conditions |
| Below 40 | Below average | Likely photo-quality issues or significant proportion gaps |

Face Shape Detector reports five proportion ratios and uses 85+ as its "exceptional" threshold. Other tools set that threshold differently. A 78 on one engine may sit at the 70th percentile on that tool's training data and at the 60th on another's, because each tool calibrates against its own dataset.
That calibration gap is why a single number means less than a trend. Run the same controlled photo three times on the same tool. If you get 72, 73, and 71, that band is reliable. If you get 65, 78, and 58, the tool or your photo conditions are introducing too much noise to trust the output.
Percentile rankings, when a tool provides them, are more useful than raw scores for cross-tool comparison. An absolute score of 70 tells you little without knowing the distribution it was drawn from.
Limitations, bias, and privacy you need to know
Before you put weight on a score, understand what these tools cannot do.
Measurement limits:
- Geometry-only focus misses everything that makes a person attractive in real life: warmth, humour, confidence, and presence.
- Training data reflects the demographics of whoever labelled it. Tools trained predominantly on one ethnic group often score faces from other groups less accurately.
- Expression and grooming change scores significantly, even when the underlying face has not changed.
- The golden ratio and similar targets are product-specific calibrations, not universal scientific laws. A high score on one tool's formula does not mean you are objectively more attractive.
Privacy checklist:
- Does the tool process images in the browser, or does it upload them to a server?
- Does the terms of service mention image retention or use for model training?
- Tools that process images client-side offer stronger privacy guarantees than those that upload and retain.
- For paid tools, check whether the privacy policy covers biometric data explicitly. In the UK, biometric data is classified as special-category data under the UK GDPR, meaning stricter rules apply to its storage and use.
Wellbeing cautions:
Repeated self-scoring can feed social comparison and negative self-image, particularly if you are already anxious about your appearance. Healthier engagement with beauty assessments means treating them as experimental input, not as a measure of your worth. If a score affects your mood for hours, step back.
Some broader quizzes, such as those measuring confidence and social signals alongside geometry, acknowledge that attractiveness is multifaceted. A geometry-only score captures one narrow slice of that picture.
The psychology of attraction makes clear that non-physical cues, including posture, eye contact, and vocal tone, often outweigh facial geometry in real-world attraction. A score of 65 with genuine warmth and confidence will outperform a score of 82 with none of those qualities.
How to turn your attractiveness-test report into better dating photos
A score without a plan is just a number. Here is how to convert the report into real improvements on your profile.
- Read the metric breakdown first. Identify which specific metrics are pulling your score down. Is it symmetry? Lighting affecting skin texture? A proportion ratio? Start there, not with the overall number.
- Pick one variable to change. If lighting is the issue, fix only lighting in the next photo. Changing multiple things at once means you cannot tell what worked.
- Retake a controlled photo. Same spot, same camera, same distance. Change only the one variable you identified.
- Re-run the test. Compare the new score to your baseline. A consistent improvement of five or more points on the same tool suggests the change was meaningful.
- A/B test on your dating profile. Swap your lead photo and track right-swipes or match rate over a week. Geometric gains only matter if they translate to real-world results. Well-run photo experiments pair metric-driven changes with real-world validation to confirm whether geometric improvements actually raise match rates.
- Sequence your improvements. Lighting first (biggest impact on most metrics), then angle, then expression, then grooming. Do not jump to expensive fixes before the free ones are dialled in.
- Use DoubleMyMatches to validate your final lineup. Once you have a shortlist of improved photos, DoubleMyMatches' AI photo analysis ranks them best-to-worst for your chosen app (Tinder, Hinge, or Bumble), flags any photo that actively hurts your profile, and gives per-photo feedback on lighting, expression, and composition. Images are analysed once and then discarded.
The goal is iteration, not perfection. Each controlled change teaches you something about your face, your camera, and your profile.
Common misconceptions about attractiveness scores
"A high score means I will get more matches." Not automatically. A score measures geometric harmony in a controlled photo. Your profile photo also needs to communicate personality, context, and approachability. A technically perfect face in a flat, lifeless photo often underperforms a slightly lower-scoring photo with energy and warmth.
"The golden ratio is a scientific law." It is a design heuristic that some tools use as a calibration target. Developers themselves note it is a product-specific choice, not a biological constant. Different tools weight it differently or ignore it entirely.
"My score is fixed." Photo conditions account for a significant portion of score variation. Better lighting, a cleaner angle, and a more neutral expression can shift your result noticeably without changing your face at all.
"AI scores are objective." They are consistent within a single tool, but they reflect the biases of the training data and the choices of whoever designed the formula. Two tools can score the same photo differently because they are measuring different things with different weights.
"A low score means I am unattractive." Attractiveness is a mix of features and behaviour, and confidence and authenticity play a large role. Geometry-only tools measure one narrow dimension. Research on facial attractiveness consistently shows that perceived attractiveness involves far more than proportion ratios.
How hairstyle, makeup, and accessories affect your score
Non-facial factors can shift your score significantly, and knowing how to handle them makes your results more useful.
Hairstyle affects landmark detection directly. Hair covering the forehead hides the hairline, which is a reference point for facial thirds. Hair falling across the eye area obscures canthal tilt and eye-width measurements. For a test photo, pull hair back. For your actual dating profile, use the hairstyle you wear day-to-day, then compare the two scores to see the real-world gap.
Makeup influences both geometric and appearance metrics. Contouring can alter the apparent jawline and nose width. Eye makeup changes perceived eye size. If a tool includes skin texture or clarity scoring, foundation and concealer will affect that layer. For a baseline score, go bare or minimal. For profile-photo planning, test with your usual look to see how it reads to the algorithm.
Accessories such as glasses, earrings, or hats can partially occlude landmarks. Glasses frames sit across the nose bridge and can interfere with nose-width measurements. Hats cut off the forehead. For accurate scoring, remove accessories for the test photo. For your actual profile, test both versions: the algorithm's preference and your real-world presentation may differ.
The practical rule: run your attractiveness test in a clean, accessory-free photo to get a reliable geometric baseline. Then photograph yourself as you actually look for dates and run that through a profile-specific tool like DoubleMyMatches, which evaluates photos for dating-app appeal rather than pure geometry.
Key takeaways
An AI attractiveness test gives you a reproducible geometric score from a single photo. Use it as a starting point for photo improvement, not as a measure of your overall appeal.
| Point | Details |
|---|---|
| What a test measures | Geometric ratios (symmetry, thirds, fifths, golden ratio) from landmark detection, not personality or real-world appeal. |
| Getting a reliable photo | Neutral expression, frontal angle, even lighting, no filters, hair off the forehead, single face in frame. |
| Interpreting scores responsibly | Trust a consistent trend across multiple controlled tests; a single result carries too much noise to act on alone. |
| Scores are not fixed | Photo conditions (lighting, angle, expression) account for significant variation; improve these before assuming the score reflects your face. |
| DoubleMyMatches for profile use | DoubleMyMatches ranks your photos best-to-worst for Tinder, Hinge, or Bumble, gives per-photo feedback, and discards images after analysis. |
The score is a tool, not a truth
There is a version of using an attractiveness test that is genuinely useful: you take a controlled photo, you read the metric breakdown, you identify that your lighting is creating a shadow that tanks your symmetry score, and you fix it. Your next profile photo is measurably better. That is the whole point.
The version that does not serve you is refreshing the score repeatedly, comparing yourself to strangers, or letting a number below 70 sit in your head for the rest of the day. Geometry is one input into a very complicated human experience. Research on the psychology of attraction shows that confidence, warmth, and social fluency shape perceived attractiveness in ways no landmark model can capture. A score of 65 with genuine presence will outperform a score of 85 with none.
Cultural context matters too. What reads as attractive varies across communities, age groups, and platforms. An algorithm trained on one dataset carries those biases quietly. Use the score to improve your photos. Do not use it to define yourself.
DoubleMyMatches goes further than a facial geometry score
A free attractiveness test tells you about your face's proportions. DoubleMyMatches tells you which of your photos will actually get you more right-swipes on Tinder, Hinge, or Bumble, and why.

Upload your photos and the AI ranks them from strongest to weakest for your chosen app. You get per-photo feedback on lighting, expression, and composition, a personalised lineup recommendation, and a clear flag on any photo that is actively hurting your profile. The analysis runs once, your images are discarded immediately afterwards, and nothing is used to train the model.
It is the difference between knowing your symmetry score and knowing which photo to put first. See how your current lineup stacks up with the DoubleMyMatches Dating Photo Analyzer, or compare your options on the photo analyzer comparison page before you decide.
Useful sources
- WikiHow — Attractiveness Score Quiz: frames attractiveness as a mix of features and behaviour, useful context for understanding what geometry-only scores miss.
- ELLE — How Healthy Is Your Beauty Perception?: practical wellbeing guidance on engaging with beauty assessments without letting them drive self-image decisions.
- PMC — Facial Attractiveness Research: peer-reviewed research on symmetry and perceived attractiveness, useful for understanding the scientific basis behind symmetry metrics.
- PMC — Attractiveness and Social Perception: covers how perceived attractiveness involves factors well beyond facial geometry.
- White Rose Research — Psychometrics of Rating Facial Attractiveness: examines how rating scales affect attractiveness scores, relevant to understanding why different tools produce different numbers.
- PMC — Attraction and Social Behaviour: research on the role of confidence and social signals in perceived attractiveness, supporting the wellbeing and limitations sections.
- DoubleMyMatches Blog — How Attractive Am I?: practical guide to using AI attractiveness assessments for dating profile improvement, with context on photo experimentation and match-rate validation.